As the world continues to grow in terms of technology, data visualization also continues to secure a significant position across a wide range of industries. Currently, most industries are channeling all their investment into digitization. Generally, data visualization is a clear indication of a bright future!
Photo by Luke Chesser on Unsplash
Alternatively, data visualization is termed as the data science process that states that when data is collected, it needs to be processed and modelled before it is visually presented for the final decision to be stated. Analysis has revealed that data visualization is relevant in all career fields.
Similarly, visualization works showcasing a smooth flow of operations across a given working environment. It is no secret that data visualization has a significant advantage on business operations. Let’s flow together, unveiling detailed information regarding data visualization.

Data Visualization and Big Data
In the recent days, big data has gained popularity across different industries. This has developed an incredible path for the implementation of data visualization. Most companies are currently using machine learning techniques to gather large volumes of data which has become hard to sort out.
Note that the process of big data visualization requires a powerful computer system that can ideally collect raw data to generate the desired information. The system needs to process the data and convert it into a graphical format that can easily understand and draw insights from it. However, this process might seem expensive, although it has numerous advantages.
Note that data visualization requires a technology expert who has a detailed understanding of how the raw facts can be converted into facts. Also, the data output should be presented in an orderly manner in which people can easily read and understand.

Application of Data Visualization
Healthcare
In most cases, medical professionals use choropleth maps to visualize all the essential health-related data. Note that a choropleth map uses different geographical regions assigned with different colors in relation to numeric values representing the health status within the region.
They mainly use this mechanism to show variables in health data. This might include things such as heart disease, mortality rate, and the medical data changes across different regions.
Data Scientists and Researchers
Initially, visualization began with the researchers and data scientists who used it in analyzing different data variables. They generate visual representations using visualization libraries to display the report generated at the end of the process. However, the presentation method depends on the chosen programming language and the tools used in the data collection process.
Through visually presenting data, researchers and analysts get it easy to understand the data sets and identify the respective patterns and trends in the field of research.
Finance
There is a need for all the financial professionals to tack all their investments and financial operations. Data visualization has made this easier by presenting trading tools that help financial professionals analyze the price fluctuations in the long run. Things such as Candlestick charts makes the financial analysis process easier and simple.
By analyzing the trends in the finance sector, finance professionals get it easier to invest wisely and extract the entire value of their investment.
Sales and Marketing
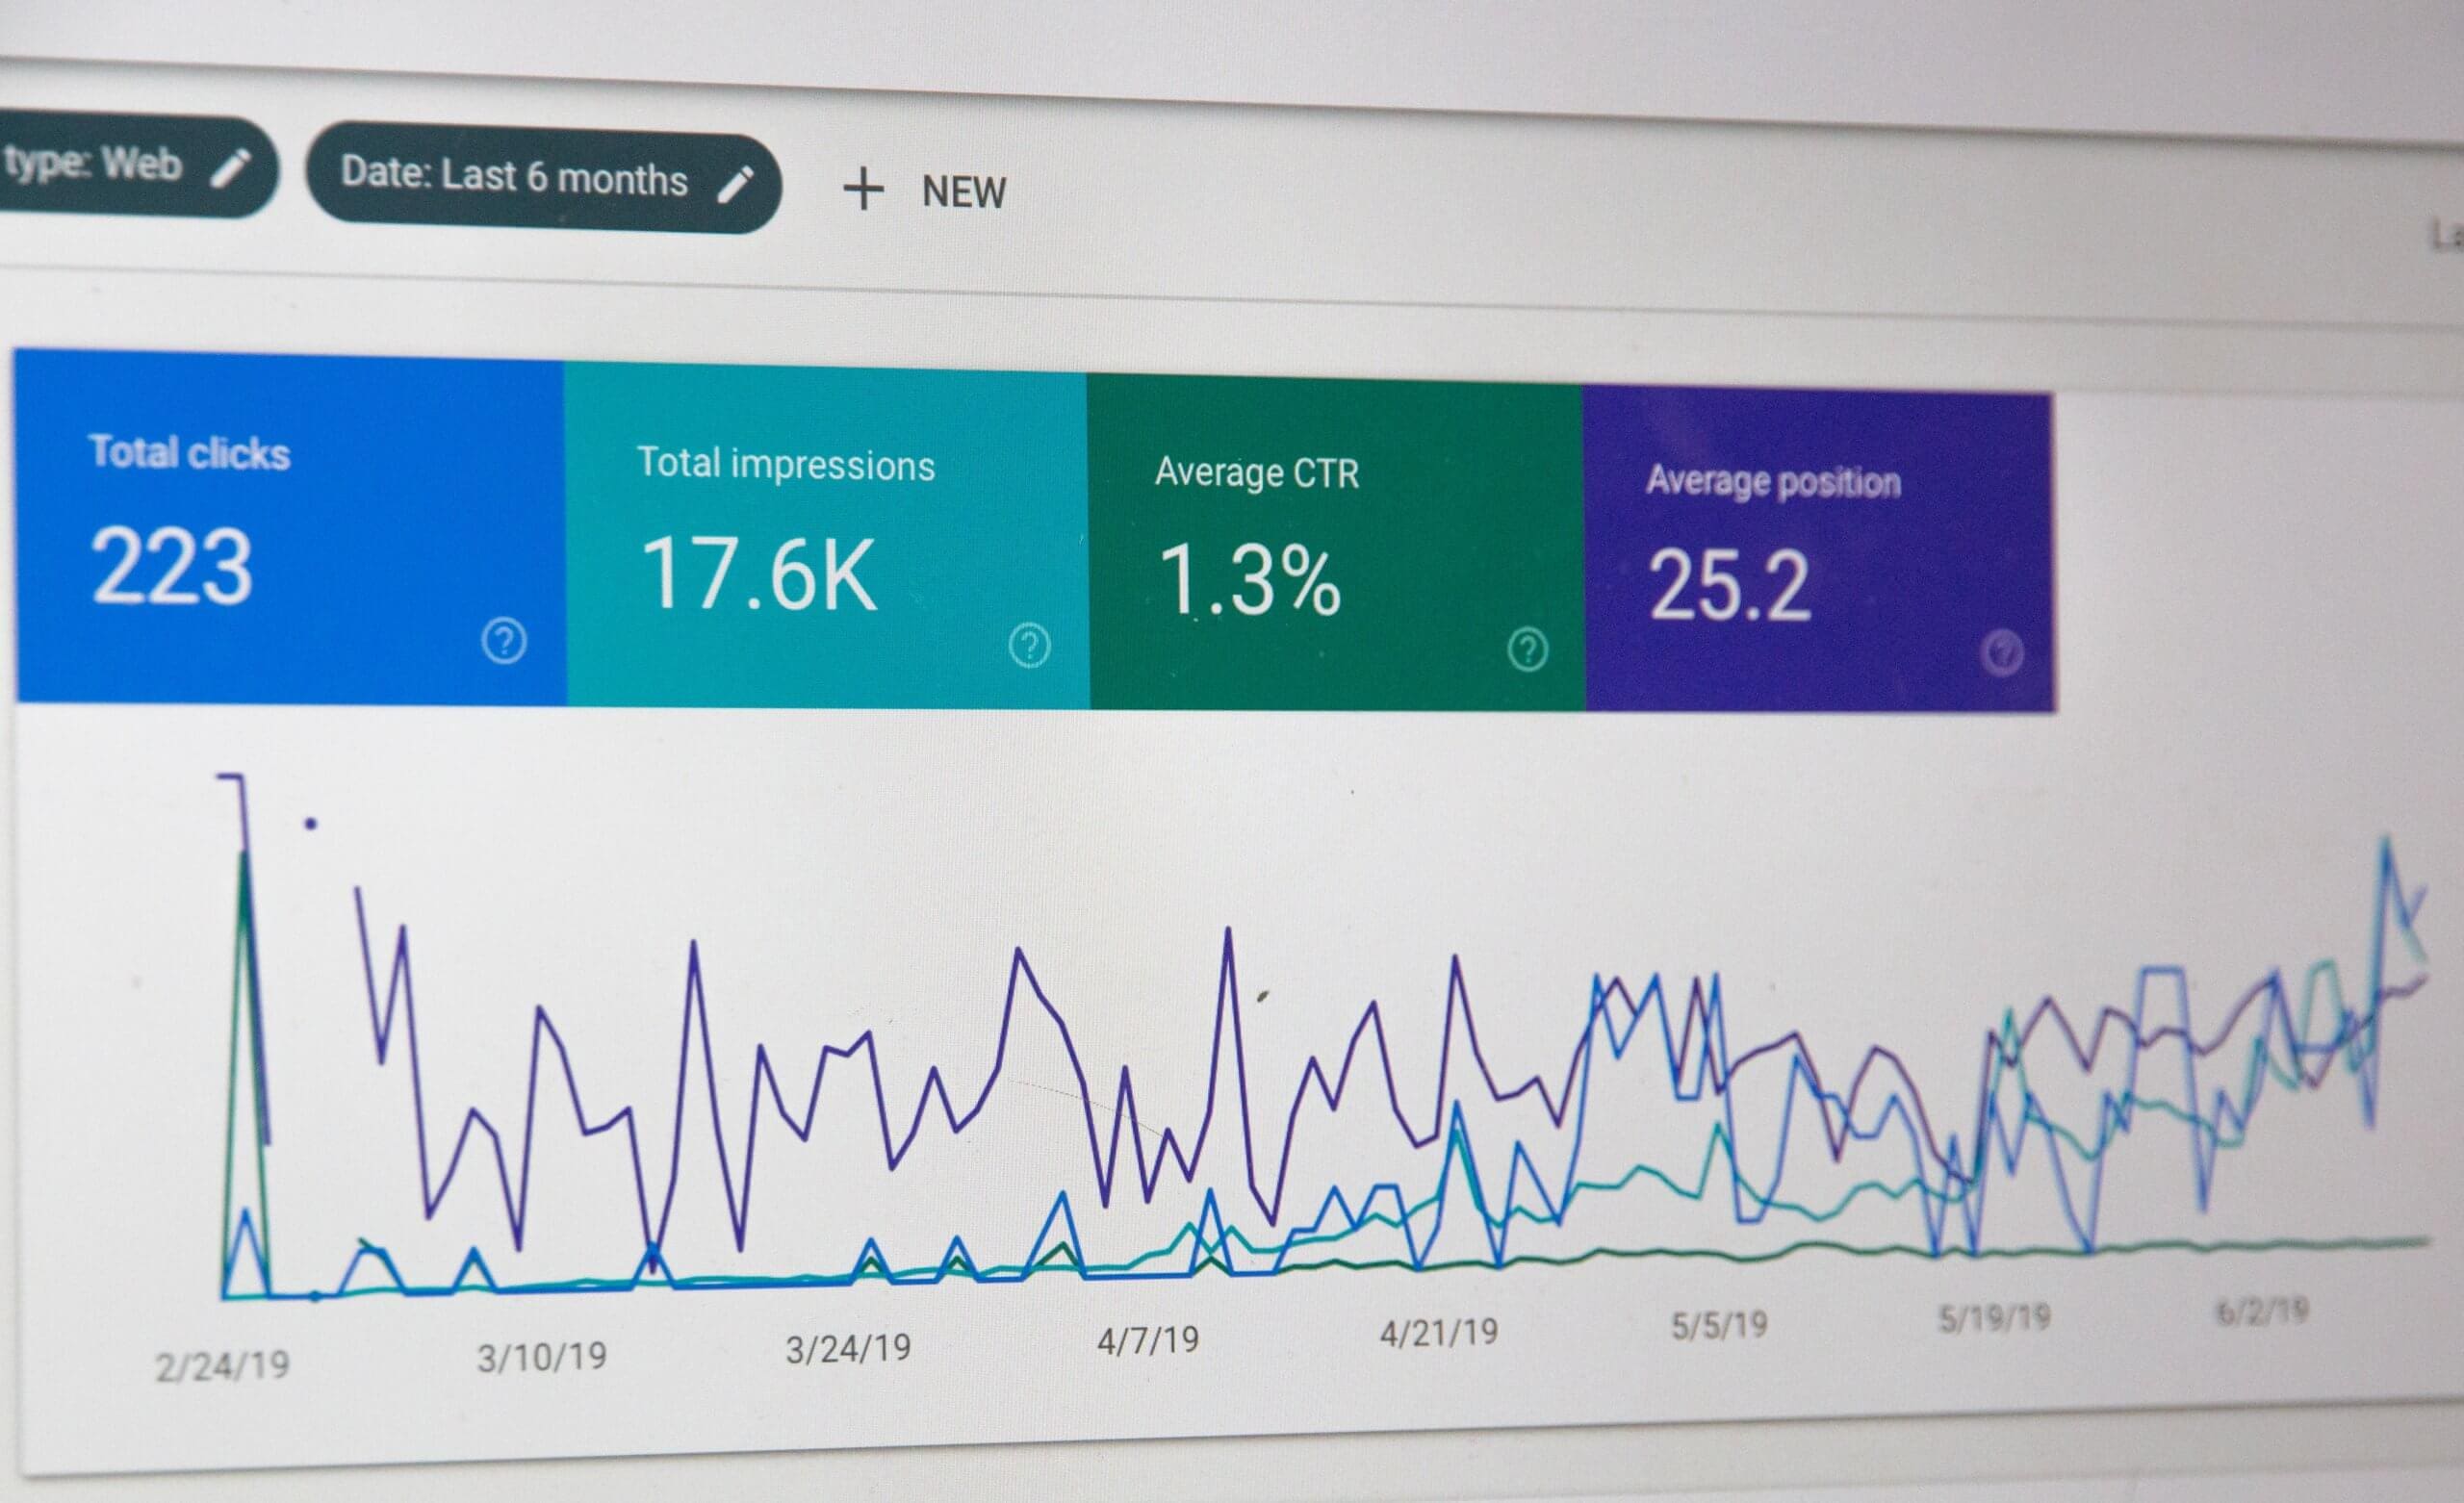
As everything gets swayed by the technology innovations, the sales and marketing teams need to build their teams. Web traffic is the best way of generating profits in the sales and marketing sector. Data visualization helps salespeople and marketers analyze the data at hand and focus on areas that need to be strengthened.
Data Visualization tools
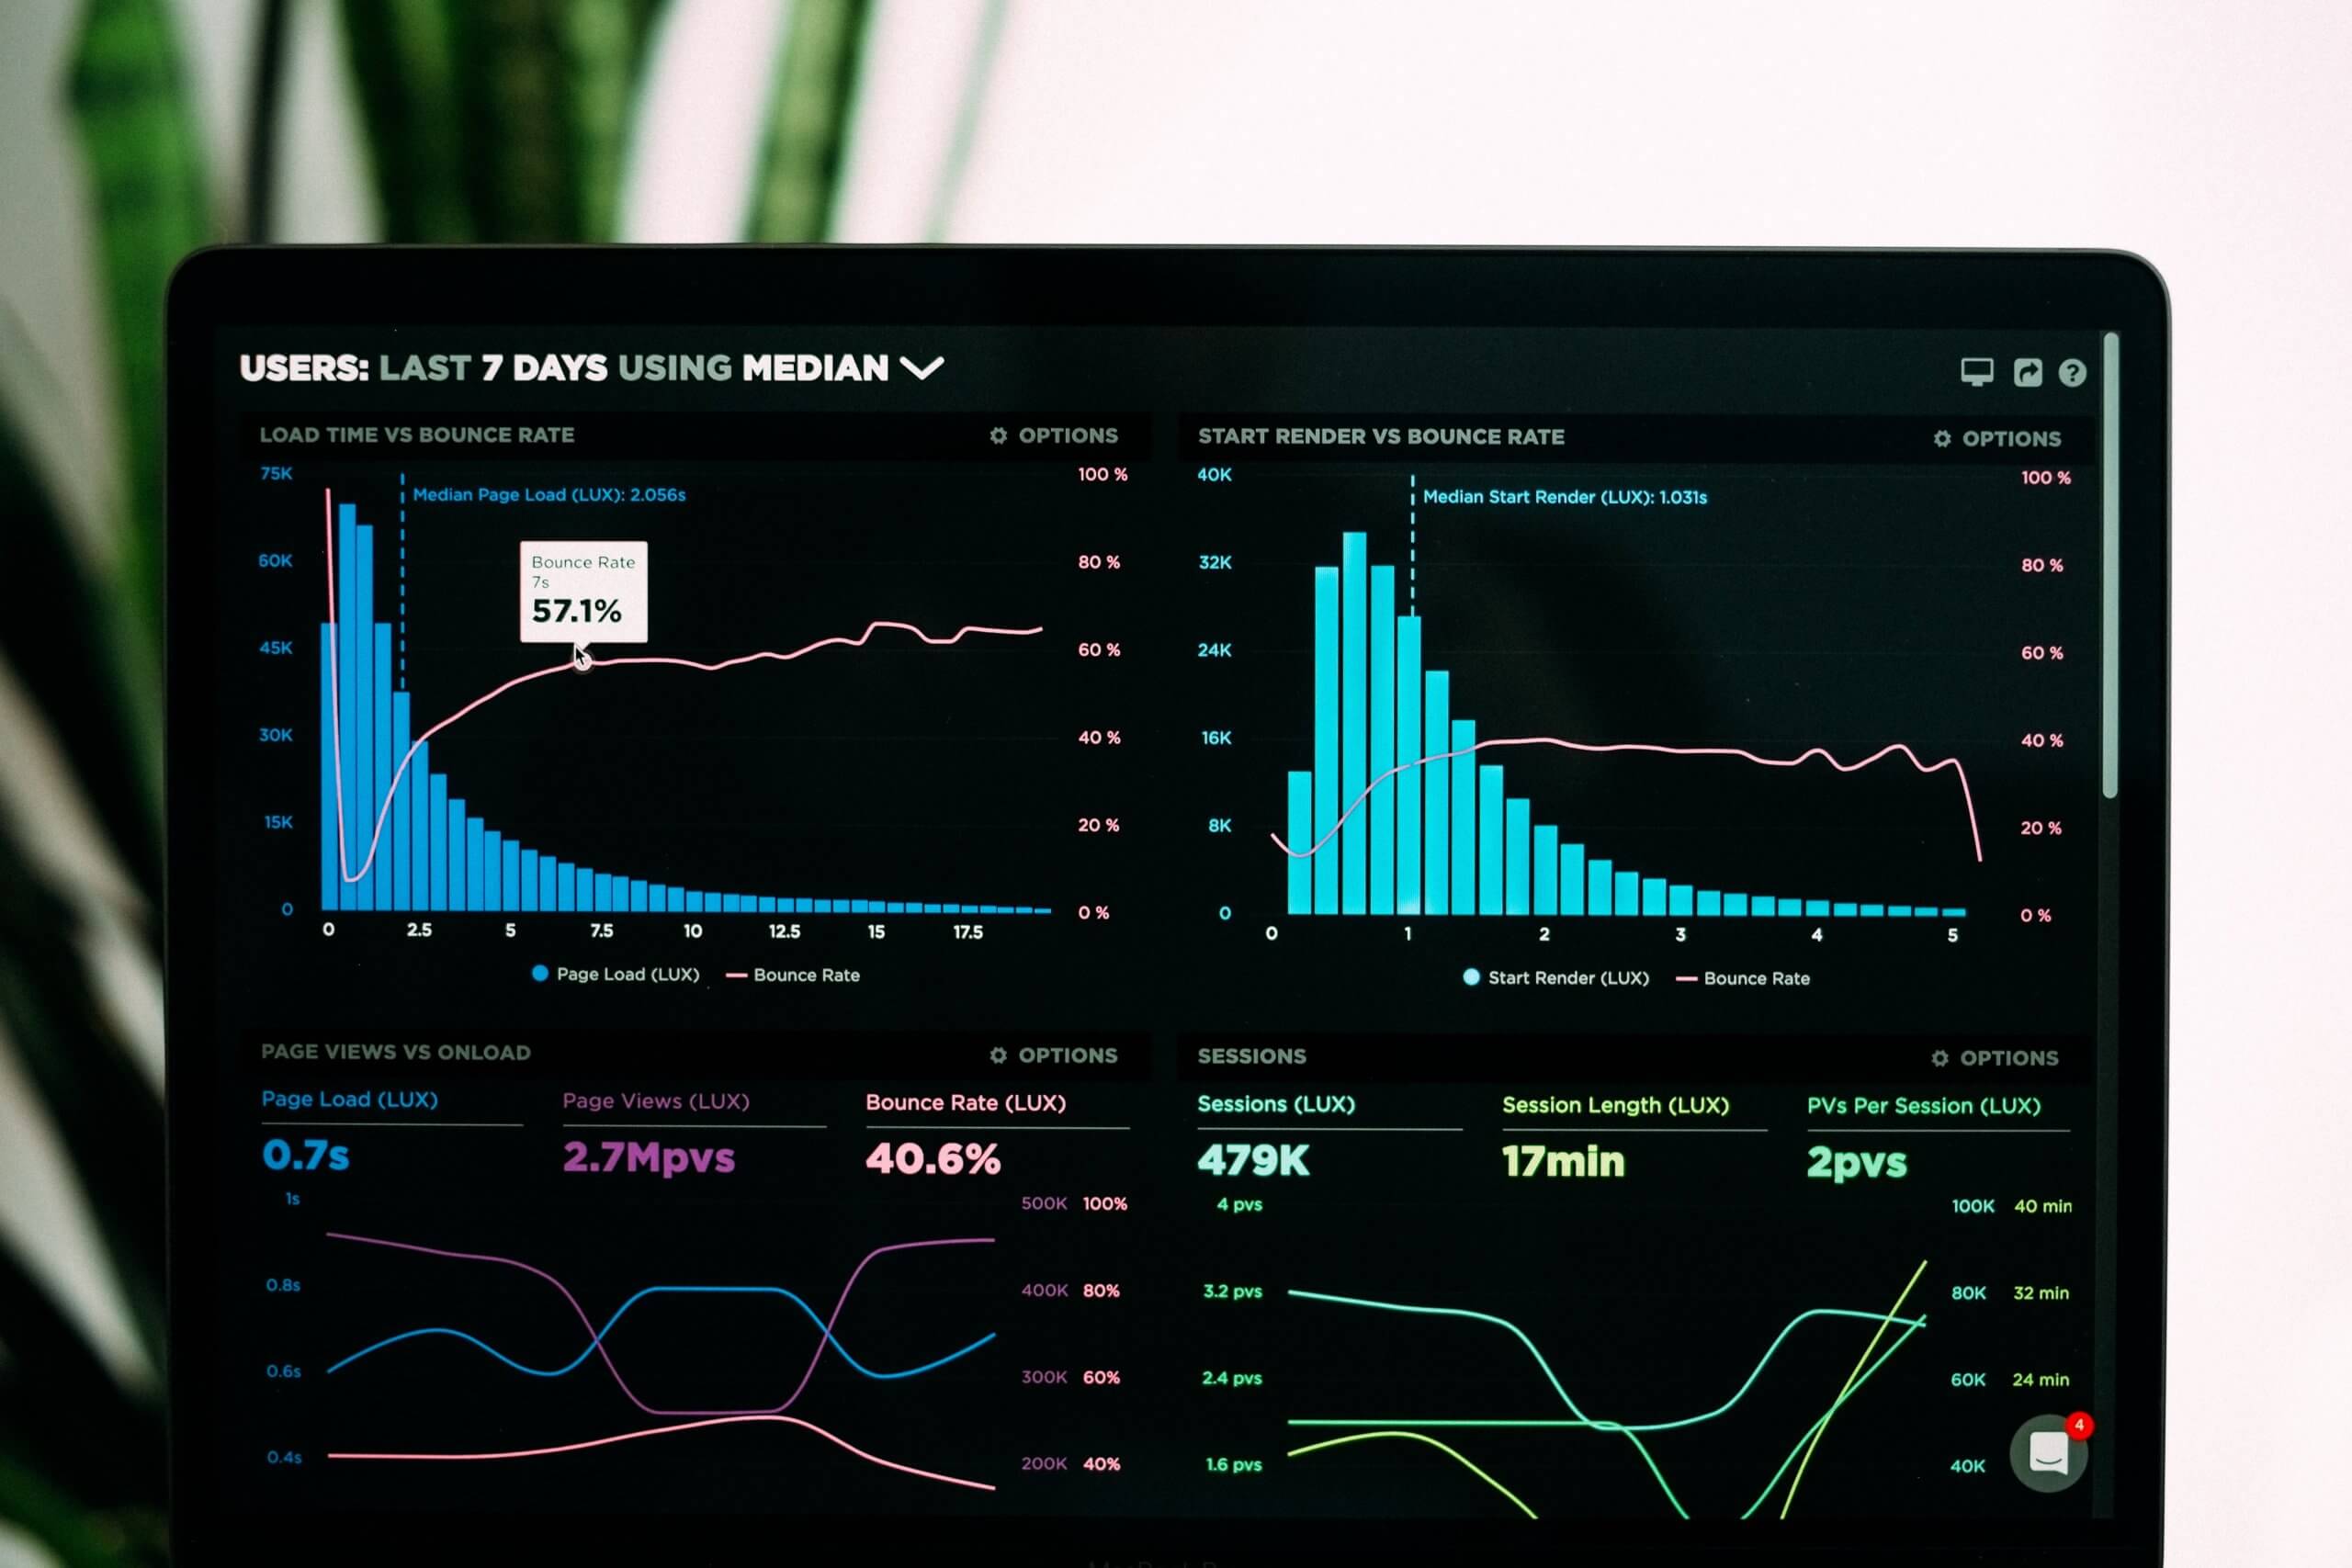
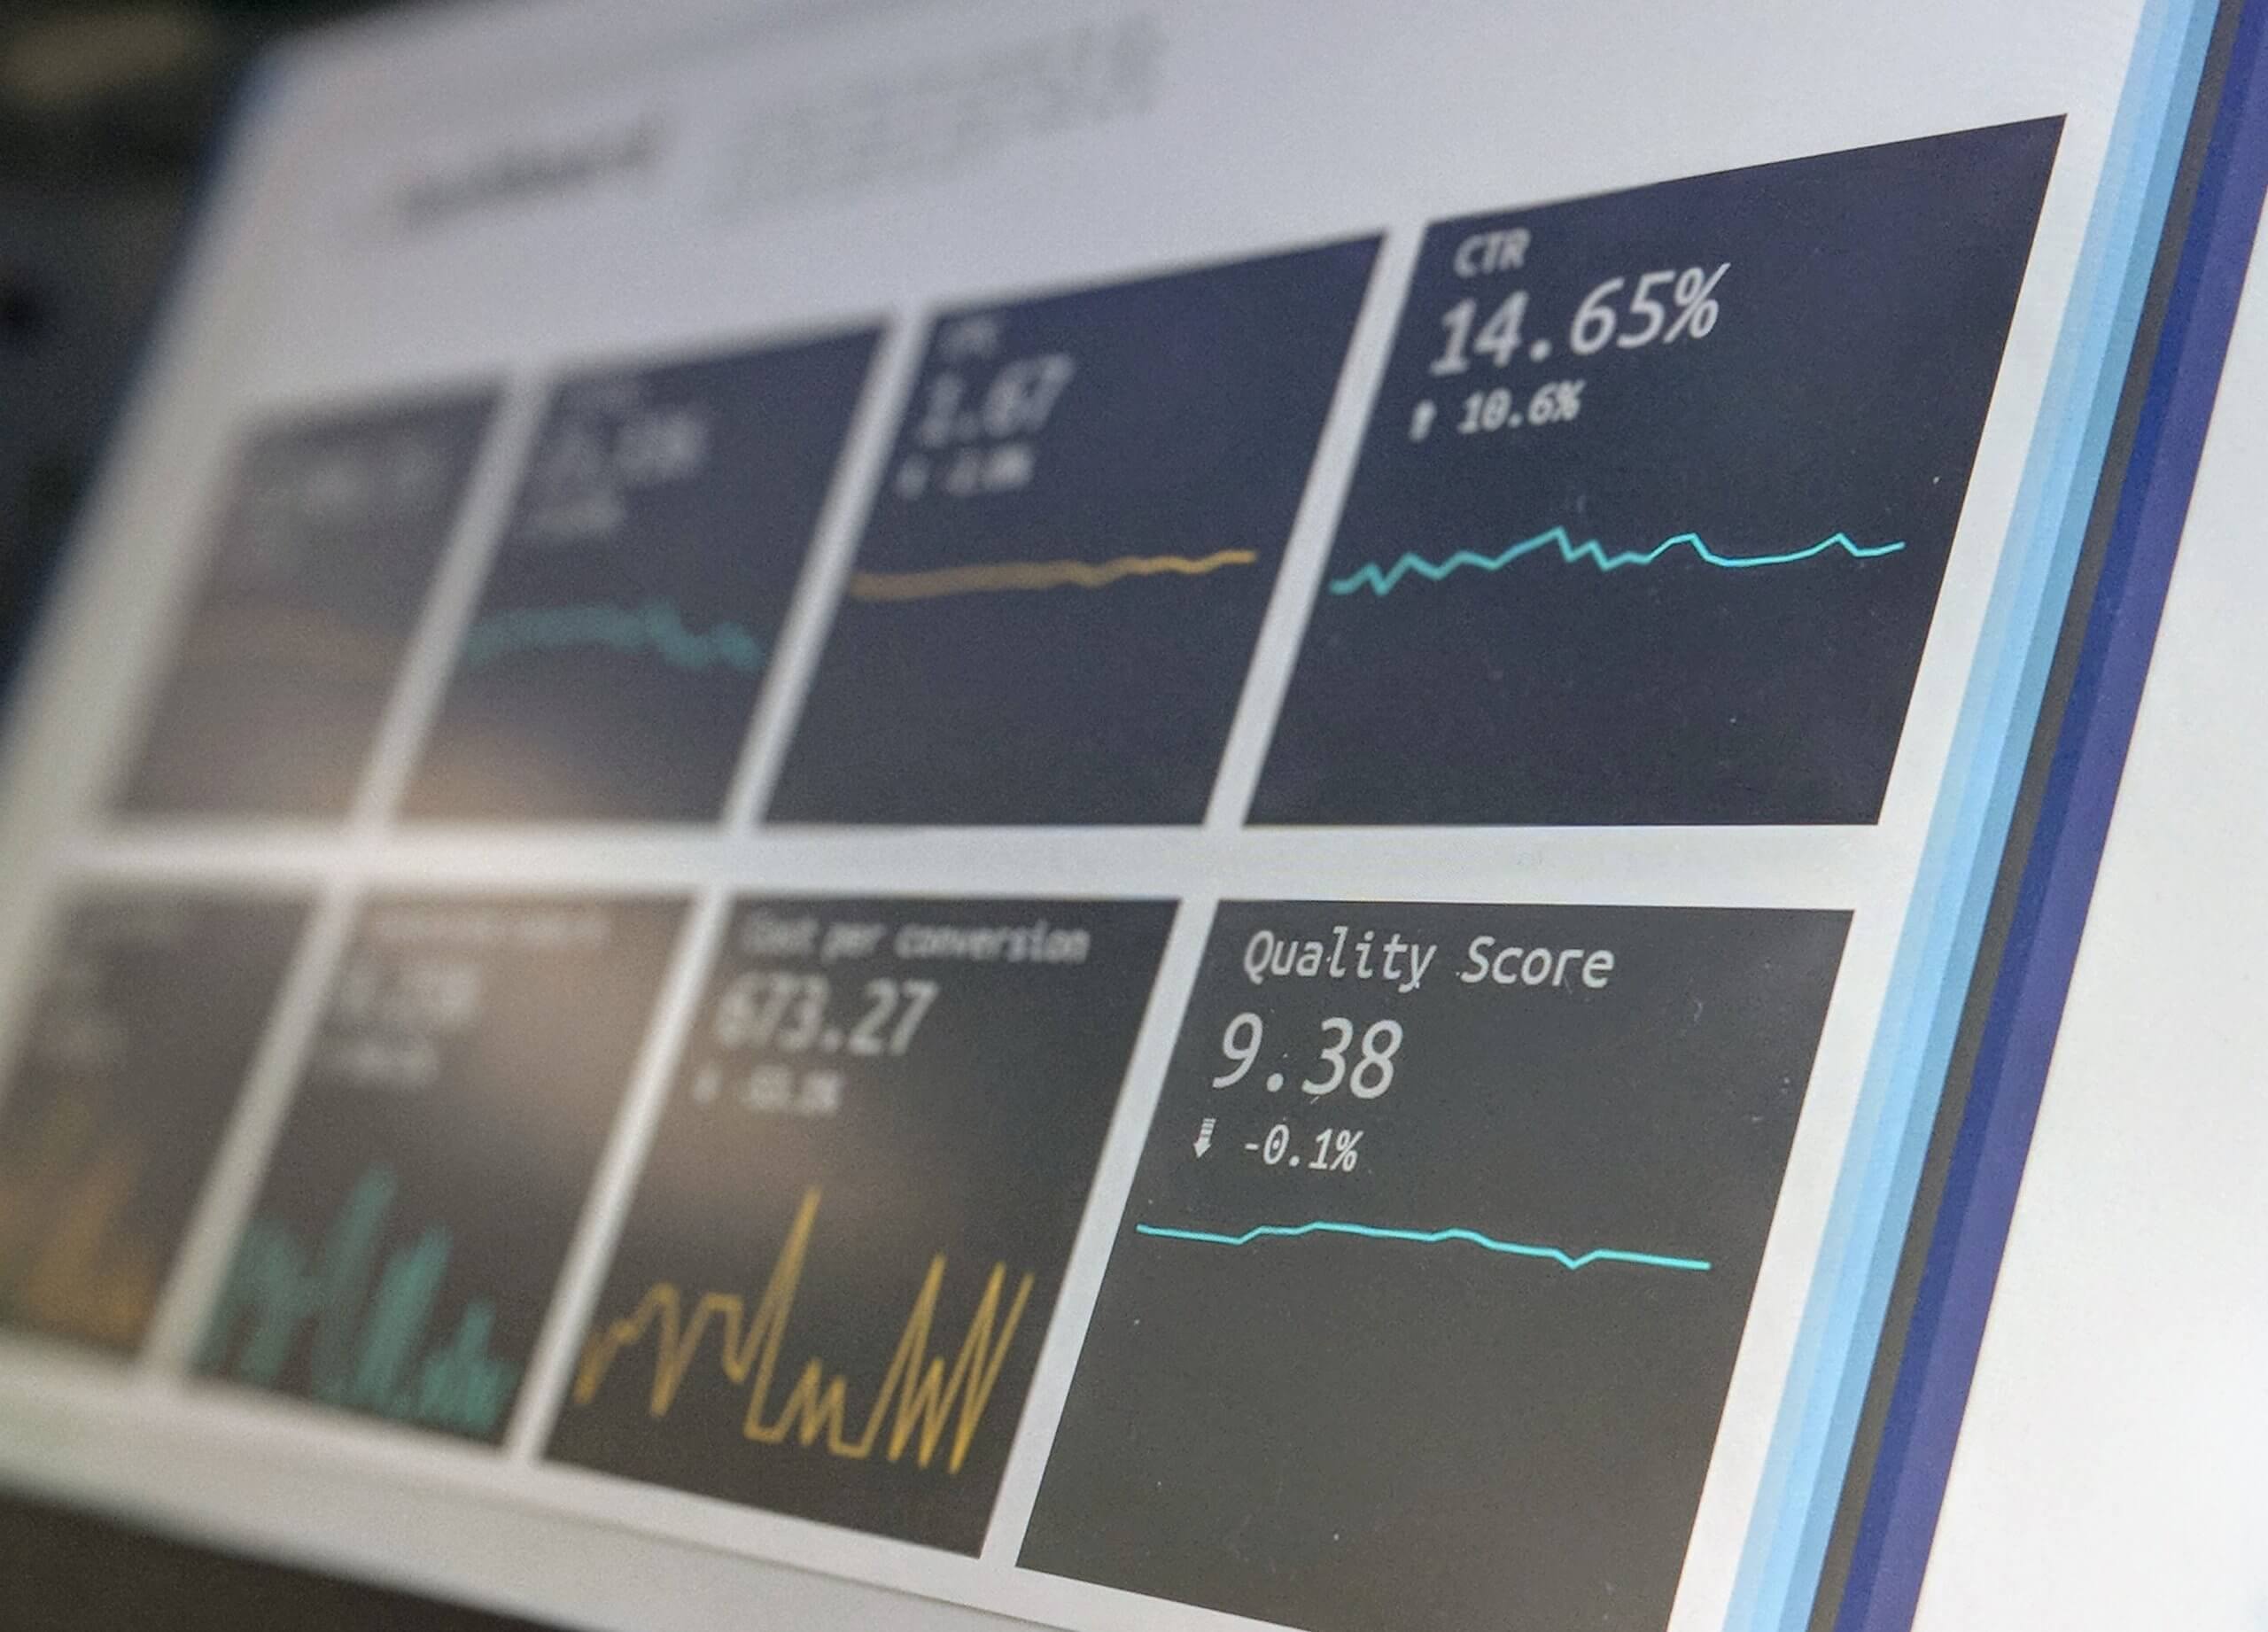
Numerous data visualization tools are used in a large variety of ways. The most common way of using the tool is in the business intelligence sector. This helps users in generating dashboards automatically. The dashboards are used to track the performance of a given company evaluating different performance key areas. There are variety of charts (bar chart, line chart, donut chart, data flow chart, scatter plot chart, Combo Chart in Excel and many more others) created on dashboard for better analysis.
The images generated through data visualization come with interactive capabilities that make them easier for users to use and manipulate. They come with indicators that alert the users when data has been updated within the files. Most companies use data visualization to oversee their business initiatives.
In most cases, marketing teams implement specific software to monitor the performance of email campaigns and track the metrics closely related to the operation. Data visualization vendors have secured ample space in big data operations to summarize and generate insights from large volumes of data.
The visualization software helps software engineers and analysts maintain track of the data sources and analyze all the data sets before and after a detailed data analysis. This works in accordance with the flow of data, focusing on the areas that require more analysis strength.
The good thing with data visualization is its ability to work with multiple programming languages that the user is comfortable with. Also, users can choose between the available tools depending on the type of analysis or research being carried out.
FAQs
What is the future of data visualization?
The future of data visualization continues to brighten as many people identifies the benefits that come with visualization. It helps by delivering infographics that can be easily converted into insights that are beneficial to the user.
Does data visualization have the capabilities of predicting the future?
Yes! Generating insights from raw data helps businesses and the world, in general, identify what is coming on the way or what to expect during various times. The infographics produced by data visualization have detailed information regarding the future.
Is data visualization high on demand?
The market demand for data visualization is growing at a competitive rate. Currently, many people are on the lookout to check if implementing data visualization will be beneficial. As the market grows bigger, many people are tapping into visualization to stand out in the industry.
Conclusion
Considering the achievement strides that data visualization has attained, the future is bright! Currently, visualization has been adopted in different fields across the industries creating a comprehensive room for the growth and development of visualization. Generally, for anyone who intends to emerge victorious in future, data visualization is a basic necessity!